R Programmers Earn More than Python Programmers

Posted on Mon 15 April 2019 in R • Tagged with R, NewsLeave a comment

At least globally, that is. According to the 2019 Stack Overflow Developer Survey, R users globally reported earning an average of $64k per year, $1k more than the $63k reported by Python developers. In the United States, that situation reverses, with Python programmers earning $116k and R programmers $108k.

Continue reading
Announcement: Register by Friday for Free R Training Sessions

Posted on Wed 10 April 2019 in R • Tagged with R, TrainingLeave a comment

I run this blog because I want to help you learn to be a better R user! But in order to do that, I need to know more about where you are in your journey and the kinds of problems you're facing.

So, I'm excited to announce that ...

Continue reading

The Ultimate Opinionated Guide to Base R Date Format Functions

Posted on Tue 09 April 2019 in R • Tagged with R, DateLeave a comment

When I was first learning R, working with dates was one of the hardest and most time consuming tasks I dealt with. There are so many things to learn! What do I do with as.POSIXct(), as.POSIXlt(), strftime(), strptime(), format(), and as.Date()? R date formats were confusing, and ...

Continue reading

How to Filter in R: A Detailed Introduction to the dplyr Filter Function

Posted on Mon 08 April 2019 in R • Tagged with R, dplyr, filter, How ToLeave a comment

Data wrangling. It's the process of getting your raw data transformed into a format that's easier to work with for analysis.

It's not the sexiest or the most exciting work.

In our dreams, all datasets come to us perfectly formatted and ready for all kinds of sophisticated ...

Continue reading

How to Create a Bar Chart Race in R - Mapping United States City Population 1790-2010

Posted on Thu 04 April 2019 in R • Tagged with R, Bar Chart Race, How ToLeave a comment

In my corner of the internet, there's been an explosion over the last several months of a style of graph called a bar chart race. Essentially, a bar chart race shows how a ranked list of something--largest cities, most valuable companies, most-followed Youtube channels--evolves over time. Maybe you've ...

Continue reading

You Need to Start Branding Your Graphs. Here's How, with ggplot!

Posted on Wed 27 February 2019 in R • Tagged with R, Branding, How ToLeave a comment

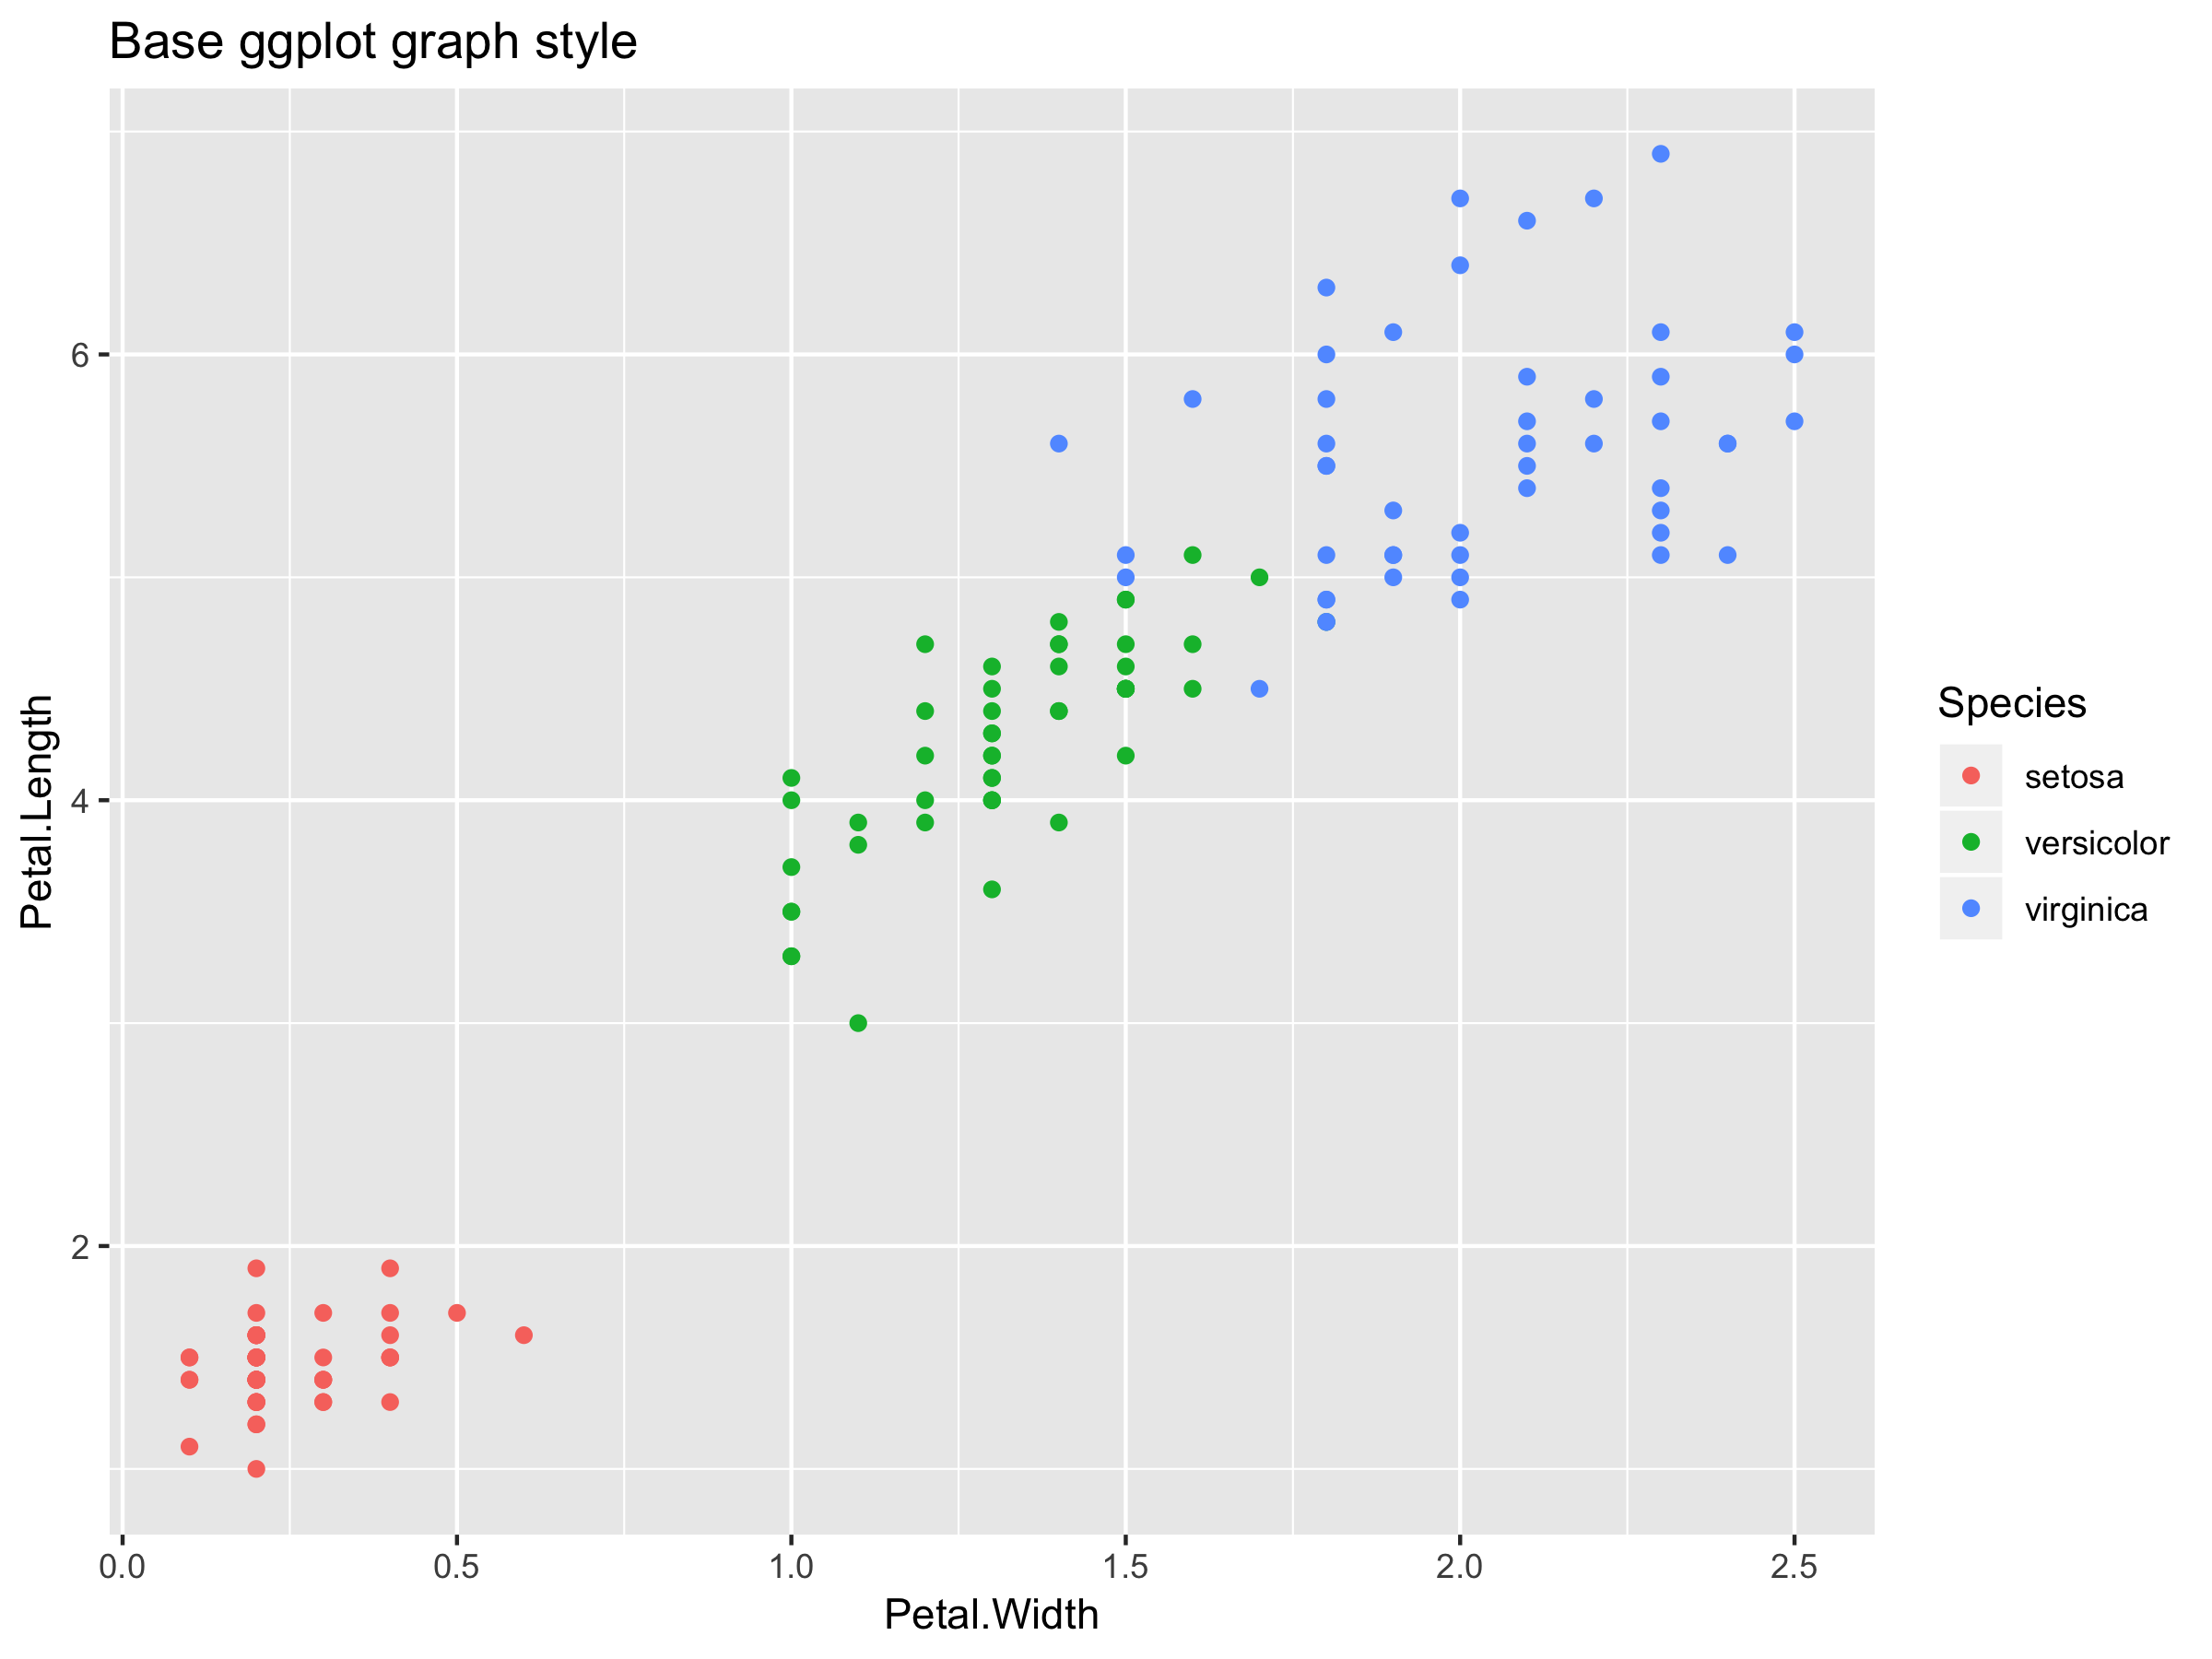
In today's post I want to help you incorporate your company's branding into your ggplot graphs. Why should you care about this? I'm glad you asked!

  center  

Have you ever seen a graph that looks like this? Of course you have! This is the default ggplot theme, and ...

Continue reading

I'm Blogging Again!

Posted on Thu 10 January 2019 in blog • Tagged with Goals, 2019Leave a comment

As 2018 comes to a close, I wanted to take some time to reflect on what I was up to in 2018 and what I'm planning for 2019. In particular, I am committing to blogging biweekly, for a total of 26 blog posts this year!

Continue reading

How to Write Pelican Blog Posts using RMarkdown & Knitr, 2.0

Posted on Wed 14 June 2017 in R • Tagged with R, Pelican, BlogLeave a comment

A clean & easy workflow for getting R analyses published as on a Pelican blog

Continue reading

Sentiment Analysis of Warren Buffett's Letters to Shareholders

Posted on Mon 20 March 2017 in R • Tagged with R, Finance, Sentiment Analysis, Warren BuffettLeave a comment

In this post I'm going to perform a text-based sentiment analysis of Warren Buffett's Berkshire Hathaway letters to shareholders from 1977 through 2016

Continue reading

How to Write Pelican Blog Posts using RMarkdown & Knitr

Posted on Thu 05 January 2017 in R • Tagged with R, Pelican, BlogLeave a comment

In this post I'm going to be talking about how to easily modify your Pelican blog configuration to let you directly publish blog posts using RMarkdown.

Continue reading