Sentiment Analysis of Warren Buffett's Letters to Shareholders
Posted on Mon 20 March 2017 in R
Last week, I was reading through Warren Buffett's most recent letter to Berkshire Hathaway shareholders. Every year, he writes a letter that he makes publicly available on the Berkshire Hathaway website. In the letters he talks about the performance of Berkshire Hathaway and their portfolio of businesses and investments. But he also talks about his views on business, the market, and investing more generally, and it's after this wisdom that many investors, including me, read what he has to say.
In many ways Warren Buffett's letters are atypical. When most companies report their financial performance, they fill their reports with dense, technical language designed to obscure and confuse. Mr. Buffett does not follow this approach. His letters are written in easily understandable language, beacuse he wants them to be accessible to everybody. Warren Buffett is not often swayed by what others are doing. He goes his own way, and that has been a source of incredible strength. In annually compounded returns, Berkshire stock has gained 20.8% since 1965, while the S&P 500 as a whole has gained only 9.7% over the same period. To highlight how truly astounding this performance is, one dollar invested in the S&P in 1965 would have grown to $112.34 by the end of 2016, while the same dollar invested in Berkshire stock would have grown to the massive sum of $15,325.46!
I've been reading the annual Berkshire letters when they come out for the last few years. One day I'll sit down and read through all of them, but I haven't gotten around to it yet. But while I was reading through his most recent letter last week, I got to thinking. I wondered whether there are any trends in his letters over time, or how strongly his writings are influenced by external market factors. I decided I could probably answer some of these questions through a high-level analysis of the text in his letters, which brings me to the subject of this blog post.
In this post I'm going to be performing a sentiment analysis of the text of Warren Buffett's letters to shareholders from 1977 - 2016. A sentiment analysis is a method of identifying and quantifying the overall sentiment of a particular set of text. Sentiment analysis has many use cases, bu a common one is to determine how positive or negative a particular text document is, which is what I'll be doing here. For this, I'll be using bing sentiment analysis, developed by Bing Liu of the University of Illinois at Chicago. For this type of sentiment analysis, you first split a text document into a set of distinct words, and then for each word determining whether it is positive, negative, or neutral.
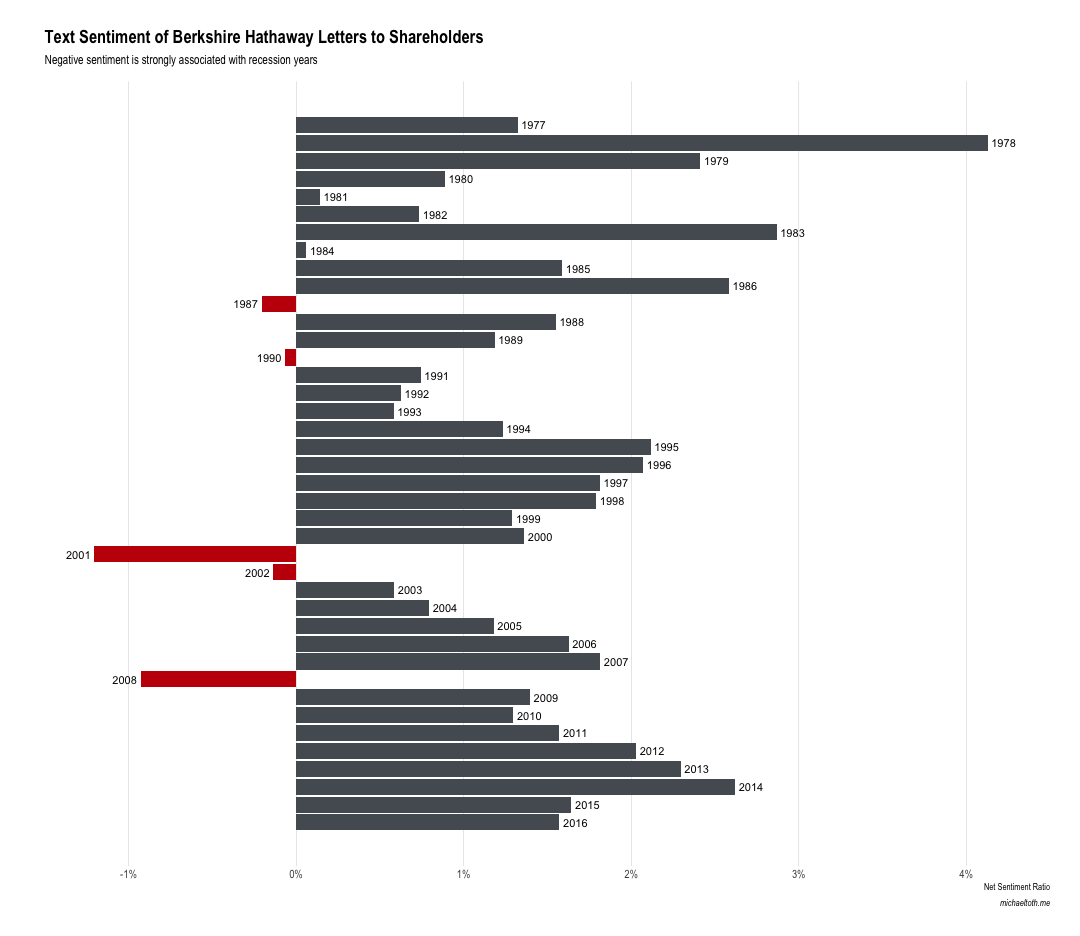
In the graph below, I show something called the 'Net Sentiment Ratio' for each of Warren Buffett's letters, beginning in 1977 and ending with 2016. The net sentiment ratio tells how positive or negative a particular text is. I'm definining the net sentiment ratio as:
(Number of Positive Words - Number of Negative Words) / (Number of Total Words)

The results here show that overall, Warren Buffett's letters have been positive. Over the forty years of letters I'm analyzing here, only 5 show a negative net sentiment score. The five years that do show negative net sentiment scores are closely tied with major negative economic events:
- 1987: The market crash that happened on October 19th, 1987 (Black Monday) is widely known as the largest single-day percentage decline ever experienced for the Dow-Jones Industrial Average, 22.61% in one day.
- 1990: The recession of 1990, triggered by an oil price shock following the United States' invasion of Kuwait, resulted in a notable increase in unemployment.
- 2001: Following the 1990s, which represented the longest period of growth in American history, 2001 saw the collapse of the dot-com bubble and associated declining market values, as well as the September 11th attacks.
- 2002: The market, already falling in 2001, continued to see declines throughout much of 2002.
- 2008: The Great Recession was a large worldwide economic recession, characterized by the International Monetary Fund as the worst global recession since before World War II. Other related events during this period included the financial crisis of 2007-2008 and the subprime mortgage crisis of 2007-2009.
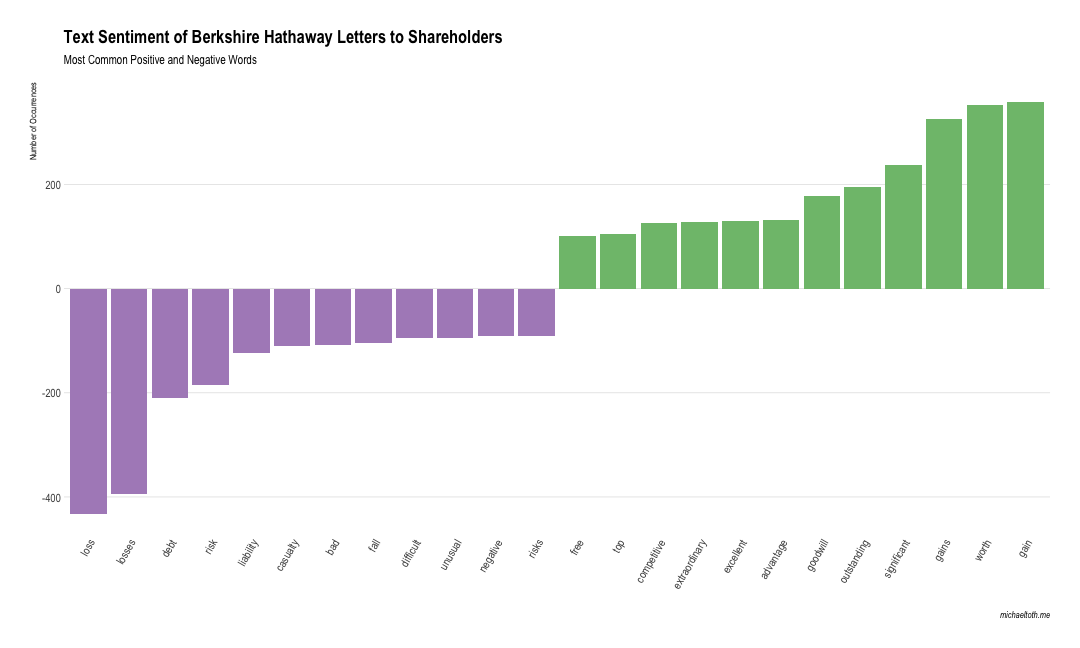
Another interesting topic to examine is which words were actually the strongest contributors to the positive and negative sentiment in the letters. For this exercise, I analyzed the letters as one single text, and present the most common positive and negative words in the graph below.

The results here are interesting. Many of the most common words--'gain', 'gains', 'loss', 'losses', 'worth', 'liability', and 'debt'--are what we'd expect given the financial nature of these documents. I find the adjectives that make their way into this set particularly interesting, as they give insight into the way Warren Buffett thinks. On the positive side we have 'significant', 'outstanding', 'excellent', 'extraordinary', and 'competitive'. On the negative side there are 'negative', 'unusual', 'difficult', and 'bad'. One interesting inclusion that shows some of the limitations of sentiment analysis is 'casualty', where Mr. Buffett is not referring to death, but to the basket of property and casualty insurance companies that make up a significant portion of his business holdings.
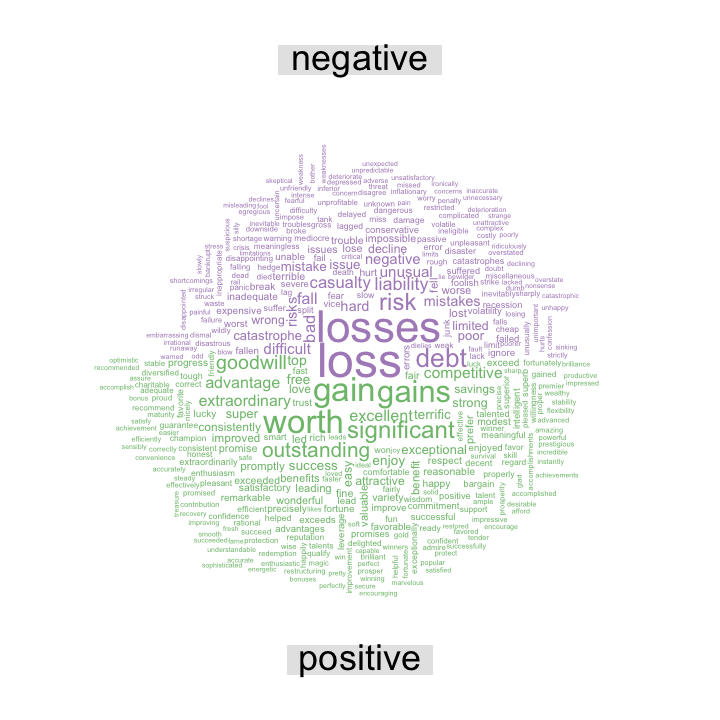
While the above is interesting, and helps us to highlight the most frequent positive and negative words, it's a bit limited in the number of words we can present before the graph becomes too crowded. To see a larger number of words, we can use a word cloud. The word cloud below shows 400 of the most commonly used words, split by positive and negative sentiment.

If you're interested in reproducing this blog post or analysis, please check out the R code I used to produce this document