Using Javascript to Visualize a Percolation System
Posted on Thu 16 October 2014 in Projects
In this post I will discuss the background for my percolation visualization page and the details of my implementation. I hope to provide a good introduction to percolation theory and the union find algorithm in particular. This is the first non-trivial Javascript application I've created, and later in the post I will discuss some of the biggest challenges I faced and things I learned along the way.
Background
The inspiration and idea for this project came directly from the similar programming assignment in Robert Sedgwick's and Kevin Wayne's Algorithms class on Coursera. In the class I implemented a percolation system in Java, and afterward I thought that it would be an interesting challenge to port that to Javascript and create a visualization on my website. For the web version I use Javascript for all of the calculations, and I use the HTML canvas element to draw the visualization to the screen.
Connectivity and the Union Find Algorithm
A connectivity problem seeks to determine, given a directed graph of sites such as the one below, whether two sites are connected via any path.
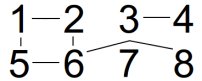
For a small set of sites like this one, a brute force approach would solve the problem effectively. If we wanted to see whether site 2 was connected to site 8, we could recursively check each site's neighbors to ultimately determine that they are connected. As the number of sites grows large however, this method does not scale, and we need a better solution. Instead of thinking of the grid of sites as a directed graph, we can convey the same information as a grouping of components as seen in the image below. Now, determining whether any two sites are connected is as simple as checking whether they are both members of the same component. Connecting two sites under this new representation involves merging their components rather than drawing paths.

The Union Find data structure, sometimes called a disjoint set data structure or a merge-find set, allows for high performance operations on a component grouping as described above. The Union Find data structure keeps track of a set of elements partitioned into a number of disjoint subsets (components). The data structure supports two main operations:
Find: Return the id of the component to which the given site is a member
Union: Connect two sites by combining their two components into a single
component with the same id
A new Union Find data structure of size N is initialized with N distinct components. In a numerical representation, the id of each component when initialized is simply the value of the site. Calls to the Union operation create a tree of components such that when two sets are combined, the members of one set will point to those of the other set. The id of the merged component is the id of the root node of this tree. The find operation returns the id of a site by traversing to the top of the tree to find the root member component id.
In this implementation, the find operation takes time proportional to the
depth of the tree. A naive implementation of the union operation could allow
trees to potentially become very deep, which would slow the performance of this
algorithm. Instead, if we modify the union function such that we always append
the smaller component to the larger component, we reduce the maximum depth of
the tree and ensure that the algorithm takes O(nlg(n)) time in the worst case.
Abbreviated Proof:
- Note: lg = log base 2
- For a given node x, its depth in the tree will increase by 1 when its tree T1
is merged into another tree T2.
- When this happens, the size of x's tree will at least double, because our
union operation requires size(T2) > size(T1) for T1 to point to T2.
- Through any number of union operations, the size of x's tree can double at
most lg(N) times [ lg(2^N) = N ], and N is the total number of nodes.
- Therefore: Traversals take O(nlg(n)) in the worst case
Below I have included my complete Javascript code for the Union Find data structure. This code is essentially the same as the Java code presented in the Coursera class mentioned above. We include two operations in addition to the find and union operations: a connected operation that returns true if two sites are connected and a count variable that returns the number of unique components.
function WeightedQuickUnionUF(N) {

    // Constructor
    var id = [];
    var sz = [];
    for (var i = 0; i < N; i++) {
        id[i] = i; // id[i] = parent of i
        sz[i] = 1; // sz[i] = number of objects in subtree with root i
    }

    // Returns the number of components, which initializes at N
    this.count = N;

    // Returns the component id for the containing site
    this.find = function(p) {
        while (p != id[p]) {
            p = id[p];
        }
        return p;
    }

    // Returns true if two elements are part of the same component
    this.connected = function(p, q) {
        return this.find(p) === this.find(q);
    }

    // Connects the components of two elements
    this.union = function(p, q) {
        var rootP = this.find(p);
        var rootQ = this.find(q);
        if (rootP === rootQ) { return; }

        // make smaller tree point to larger one
        if (sz[rootP] < sz[rootQ]) {
            id[rootP] = rootQ; sz[rootQ] += sz[rootP];
        } else {
            id[rootQ] = rootP; sz[rootP] += sz[rootQ];
        }
        this.count--;
    }
}
Percolation
The percolation problem assumes a grid of sites that can be set to either open or closed. If we imagine that water is flowing across the top of the grid, an open site will become full with water when it can be connected by other open sites in an unbroken path to the top of the grid. The system percolates when an open site on the bottom of the grid can be connected by other open sites in an unbroken path to the top of the grid, such that water will flow freely through the system, as seen in the image below.
Modeling percolation with the Union-Find algorithm
The Union Find implementation is efficient for determining whether any 2
sites are connected, but this structure would require N^2 time to check whether
any of the N sites in the top row is connected to any of the N sites in the
bottom row of the percolation grid. Similarly, this structure would require
time proportional to N to determine whether a given site is full (i.e. whether
it is connected to any of the N top row sites).
To address these issues, we create two "virtual sites" on the top and bottom of the grid. We automatically connect these virtual sites to sites on the top and bottom rows as they are opened. To determine whether a site is full, we check whether it is connected to the top virtual site. To determine whether the system percolates we check whether the top and bottom virtual sites are connected.
Interesting aside
For a large square grid of sites, there exists a percolation threshold
probability p such that if we open fewer than p percent of the sites the
system will not percolate, and if we open greater than p percent of the sites
the system will percolate. An exact expression for the percolation threshold
of a square grid is currently unknown, but through experimentation we know the
value to be approximately 0.592746. That is, for a large square grid, the
system should first percolate after we have opened 59.2746% of the sites.
Challenges
Creating the Visualization
Initially I had thought to create the grid of sites using a grid of divs which I would then be able to color according to their status, similar to my previous Mondrian Painting Project. I wanted to support the ability to change the size of the grid however, and a large number of divs seemed unnecessarily cumbersome. I did some searching on Codepen.io for ideas, and found some examples using the HTML5 canvas element, which was exactly what I needed. In particular, I liked that this output as an image that was saveable. I got to learn a lot about the HTML canvas and how it worked, and this was a fun part of the project.
Converting Implementation from Java
I had trouble initially with porting the Java code to Javascript. In Java, the well-defined class relationships were clear to me, but I did not at first understand how to implement similar structures in Javascript. After doing some research, I found that there were many ways in Javascript to accomplish a similar thing, and I ultimately used functions to implement this as they were most syntactically similar and I found this approach easiest to understand. I am still working to understand many aspects of Javascript, but this project helped my greatly with learning about how to modularize my code.
Iteratively Opening Sites and Drawing
Initially I implemented the process of opening sites and drawing to the canvas using a while loop, but this was not ideal. I could run the entire percolation simulation and then draw to the canvas, but if I tried drawing to the canvas after each site was opened, the browser would freeze. I wanted to be able to show each site being opened successively, so I needed to find a way to delay the opening of new sites until I could draw to the screen. I ended up accomplishing this through the use of Javascript's setInterval method. I ultimately used both implementations, allowing the user to choose whether to output the results instantly (using the while loop) or to output the results iteratively at two different speeds (using setInterval). The timing is controlled by the code shown below:
function outputInstantly() {
    // While loop runs until the system percolates
    while (!perc.percolates()) { // Calls the percolates method of the perc object
        openRandom();
        count++;
    }
    // Once the system percolates, draw to the screen a single time
    drawPerc.drawGrid();
}

// The user controls delay variable by selecting radio buttons on the page
if (delay === 0) {
    outputInstantly();
} else {
    // Use the setInterval function to repeatedly open sites and draw to screen (checkPerc function)
    interval = setInterval(checkPerc, delay);
    interval();
}
Bug when running multiple calculations simultaneously
My initial implementation suffered from a bug where if I reran the simulation,
either by refreshing the page or by clicking the button to run again,
the first percolation run would continue in the background. This caused
issues with the display and text output to the screen. I knew that the
solution would be to clear the interval on rerun, but I did not know how I
could access the id of setInterval, an instance variable of the previous
simulatePercolation instance, when creating a new instance of percolation.
After some experimentation, I found that if I declared the interval variable
in the head of my HTML, rather than in a separate javascript file, I could
assign it to setInterval when running simulatePercolation, which would eliminate
the possibility of duplicate intervals running simultaneously, and correct the
issues that I had been facing.
See the full code for my percolation visualization on my Github:
Percolation
Run my percolation visualization